

Is your webpage not attracting enough traffic? How do you determine the cause of that?
Well initially when people started with their online business, they never received or analyzed the statistics of the digital platform and sales.
They didn’t know much about keeping a track of their conversion ratio. Users had a difficult time figuring out what influences ranks and what can affect performance.
But it has become history now since the business community was introduced to Google Pagespeed Insights and Core Web Vitals.
It has been debatable to comprehend whether they’re the same or different tools.
But let me inform you, their objective has always been the same. So what exactly are these tools?
Core Web Vitals
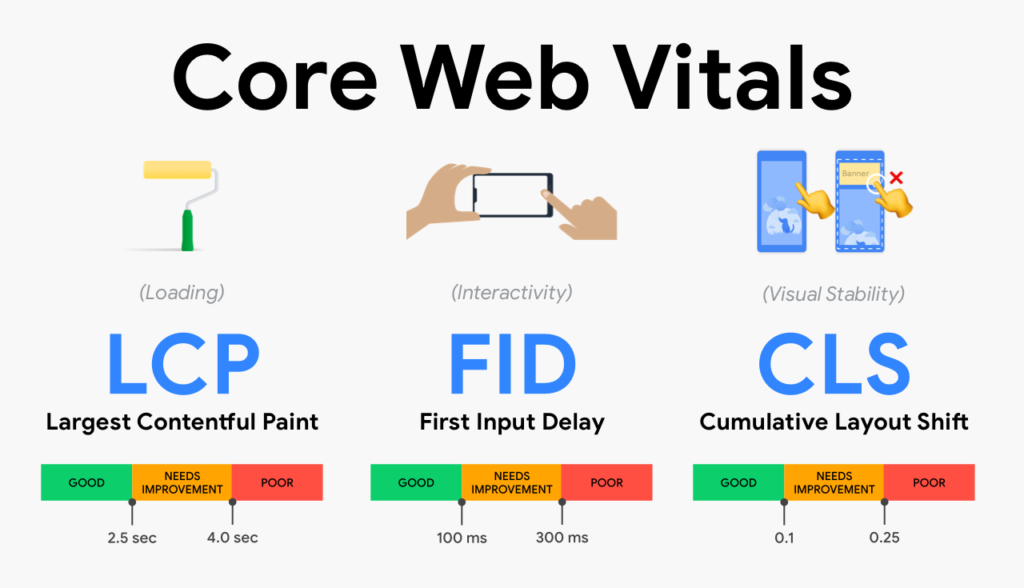
Core Web Vitals are a group of certain elements that Google believes are crucial to the overall user experience of a webpage.
The four measurements that make up these metrics are:
- Initial contentful paint
- Largest contentful paint
- First input delay
- Cumulative layout shift
Google PageSpeed Insights

On the other hand, Google PageSpeed Insights provides advanced data visualization, filtering, tagging, and snapshot technologies providing a complete solution in order to improve a website’s search engine ranking, amp up its performance, and improve the user experience.
Lighthouse 6.0 has been added to PageSpeed Insights, enabling it to measure Core Web Vitals in the report’s lab and field parts.
So basically, to get a decent Google PSI score, the Core Web Vitals should be leading in every metric factor.
The Google page speed test result is only a tool to help you with problems with your website.
It is intended to be a visible performance metric. Basically, this tool is used to assist users in locating problems.
Their scores are determined by the Core Web Vitals component of Google’s ranking algorithms.
Your pages’ PSI scores show whether or not they stick to Google’s performance and speed guidelines.
So, if the keyword rankings will be better, then higher will be the score.
Explore the measurements!
The reason behind digging deeper into the measurements is because these metrics refer to how quickly a person may access the page.
It analyses how much a page’s content hops about when a user is interacting with it and while the site is loading.
1. Initial Contentful Paint (ICP):
This is the amount of time it takes for something to appear on the page for the first time after the browser requests a URL.
The intent behind this measurement is to reduce the assumed loading time because the progress is made visible to the visitors.
Usually, render-blocking elements like stylesheets and scripts can reduce the score.
Rendering is choked whenever a stylesheet reference is introduced to HTML until the resource has finished downloading and parsing.
Here, the score can be enhanced by delivering the resources required to render what is visible to users in the viewport.
2. Largest Contentful Paint (LCP):
This is a new metric that aims to indicate how long it takes from when a request is made till the site’s actual content is prepared.
In other words, it waits until all of the fonts and images in the viewport have loaded.
Some of the techniques sites would employ to increase their ICP have shown to be ineffective now that LCP is being measured.
Making sure that the images in the viewport may load as rapidly as possible and correctly including the site fonts are crucial for enhancing the LCP.
The main objective is to minimize serial dependencies so that all material in the viewport can be displayed.
3. First Input Delay:
Sometimes a website on your phone doesn’t show up properly and the content isn’t loading even after waiting for a long time.
We can consider this lag as the Input Delay.
There could be several reasons behind this delay like complex JavaScript, Videos, Rendering complex styles, etc.
The best thing to do is lessen the amount of JS that executes on a certain page to lower FID. Put off any JS that isn’t essential for the user experience from the remaining JS.
The extent to which device performance affects FID is an important point to be aware of. Time rather than “number of scripts” is the unit of measurement for the FID score.
An older phone cannot manage the amount of computation that a contemporary computer can in a short amount of time.
A quick laptop might finish the site rendering right away and then begin working on the less important javascript.
A slower device can start to accumulate all of the site’s resources and struggle to complete any of them at once.
4. Cumulative Layout Shift:
This score looks for instances where the text you’re reading abruptly disappears from view or where the button you’re going to click moves as the page is loading.
Layout shift is an extremely annoying experience that frequently results from attempts to decrease initial load time.
Layout shift is primarily caused by picture loading.
The browser does not know how much space to set aside for an image when it is only tagged with an image tag without any extra information about the image’s size.
This means that while a picture is being properly displayed, your layout may be delayed.
The approach is to allocate space for each image on your website by specifying measurements or proportions in HTML, CSS, or both.
Now that we are clear about the measurements, let’s learn how to get a score for the website.
Google PageSpeed Test
- Enter the URL of the website whose metrics you wish to know on the PageSpeed Insights to run the Google page speed test.
- Click Analyze to start PSI’s analysis.
- The report collects Field data from the web page in the CrUX or Chrome User Experience report, as the report is being prepared, it uses the Lighthouse API to display the performance of the page.
It calculates the loading rate using mid-tier devices and mobile networks in a controlled and hypothetical setting.
This is why it’s called “Lab Data.”
- After reviewing the report, take out factors that slow down the process and lower rankings.
So, now you can measure your Core WebVitals through Google PageSpeed Insights. It can be difficult to process all of this information, especially if each point is taken out of its right context.
But every aspect of Core Web Vitals builds on a very fundamental idea: Google prefers to rank highly sites that are quick and provide a positive user experience.
Even if the measurements in this article reflect current data, it is reasonable to anticipate that Google will continue to review and improve its testing procedures to better achieve that objective.